Failure Definition
To access the Failure Definition page:
- Navigate to: Administration > Maintenance > Failure Definition
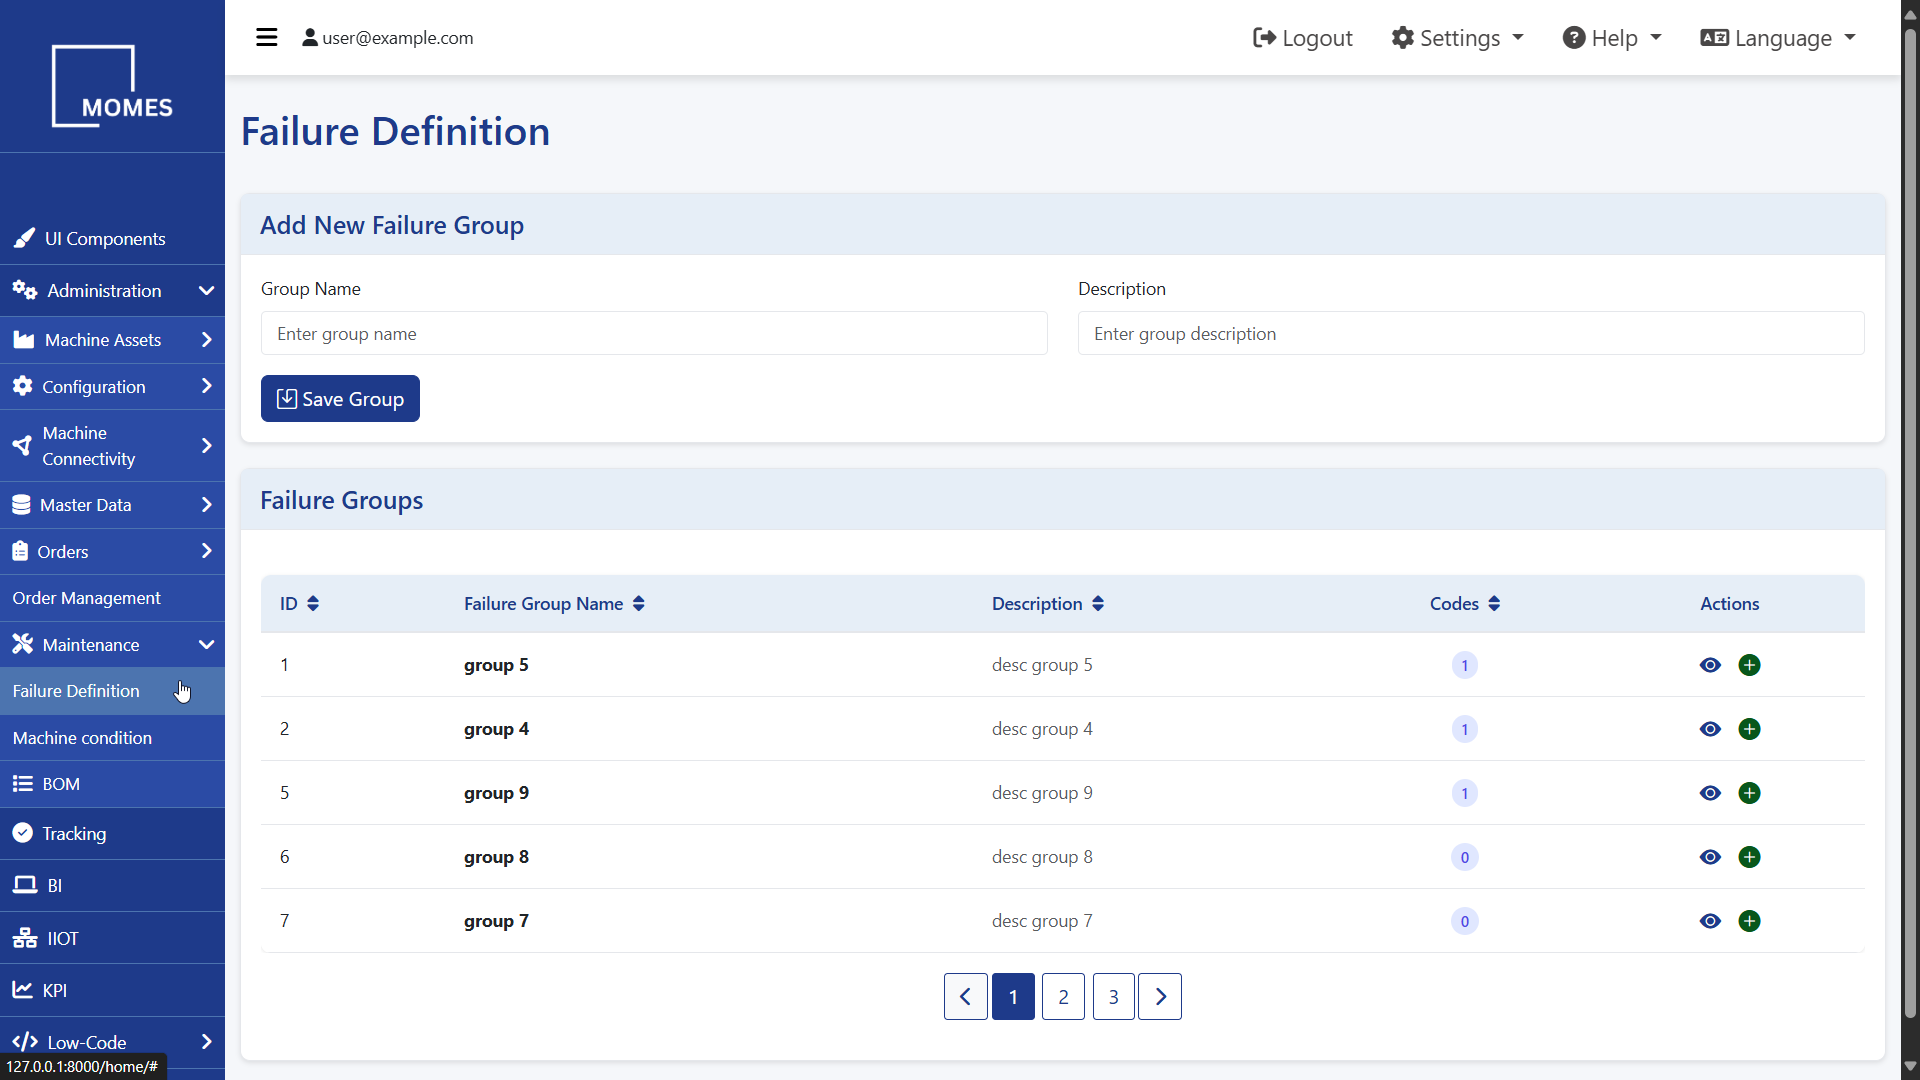
The Failure Definition page allows users to organize and manage machine or process-related failures by grouping them into structured categories. This helps in standardizing failure reporting, improving traceability, and enabling efficient root cause analysis.
What You See on This Page
- Add New Failure Group section for creating new failure categories
- Failure Groups Table: Displays existing failure groups with the following columns:
- ID: A unique identifier for each group
- Failure Group Name: The name of the group
- Description: A brief summary of what the group represents
- Codes: Indicates the number of failure codes currently associated with the group
- Actions: View and Add options for managing failure codes
This page is essential for maintenance teams and quality engineers to define structured failure categories, ensuring consistent failure handling and supporting continuous improvement initiatives.
Machine Condition
To access the Machine Condition page:
- Navigate to: Administration > Maintenance > Machine Condition
The Machine Condition page allows users to manage and organize machine status categories through the creation of Machine Groups. Each group can contain multiple condition codes, which are used to classify and track different machine states (e.g., running, idle, under maintenance, etc.).
This structured approach enhances visibility into machine behavior, improves reporting accuracy, and facilitates condition-based maintenance and analysis.
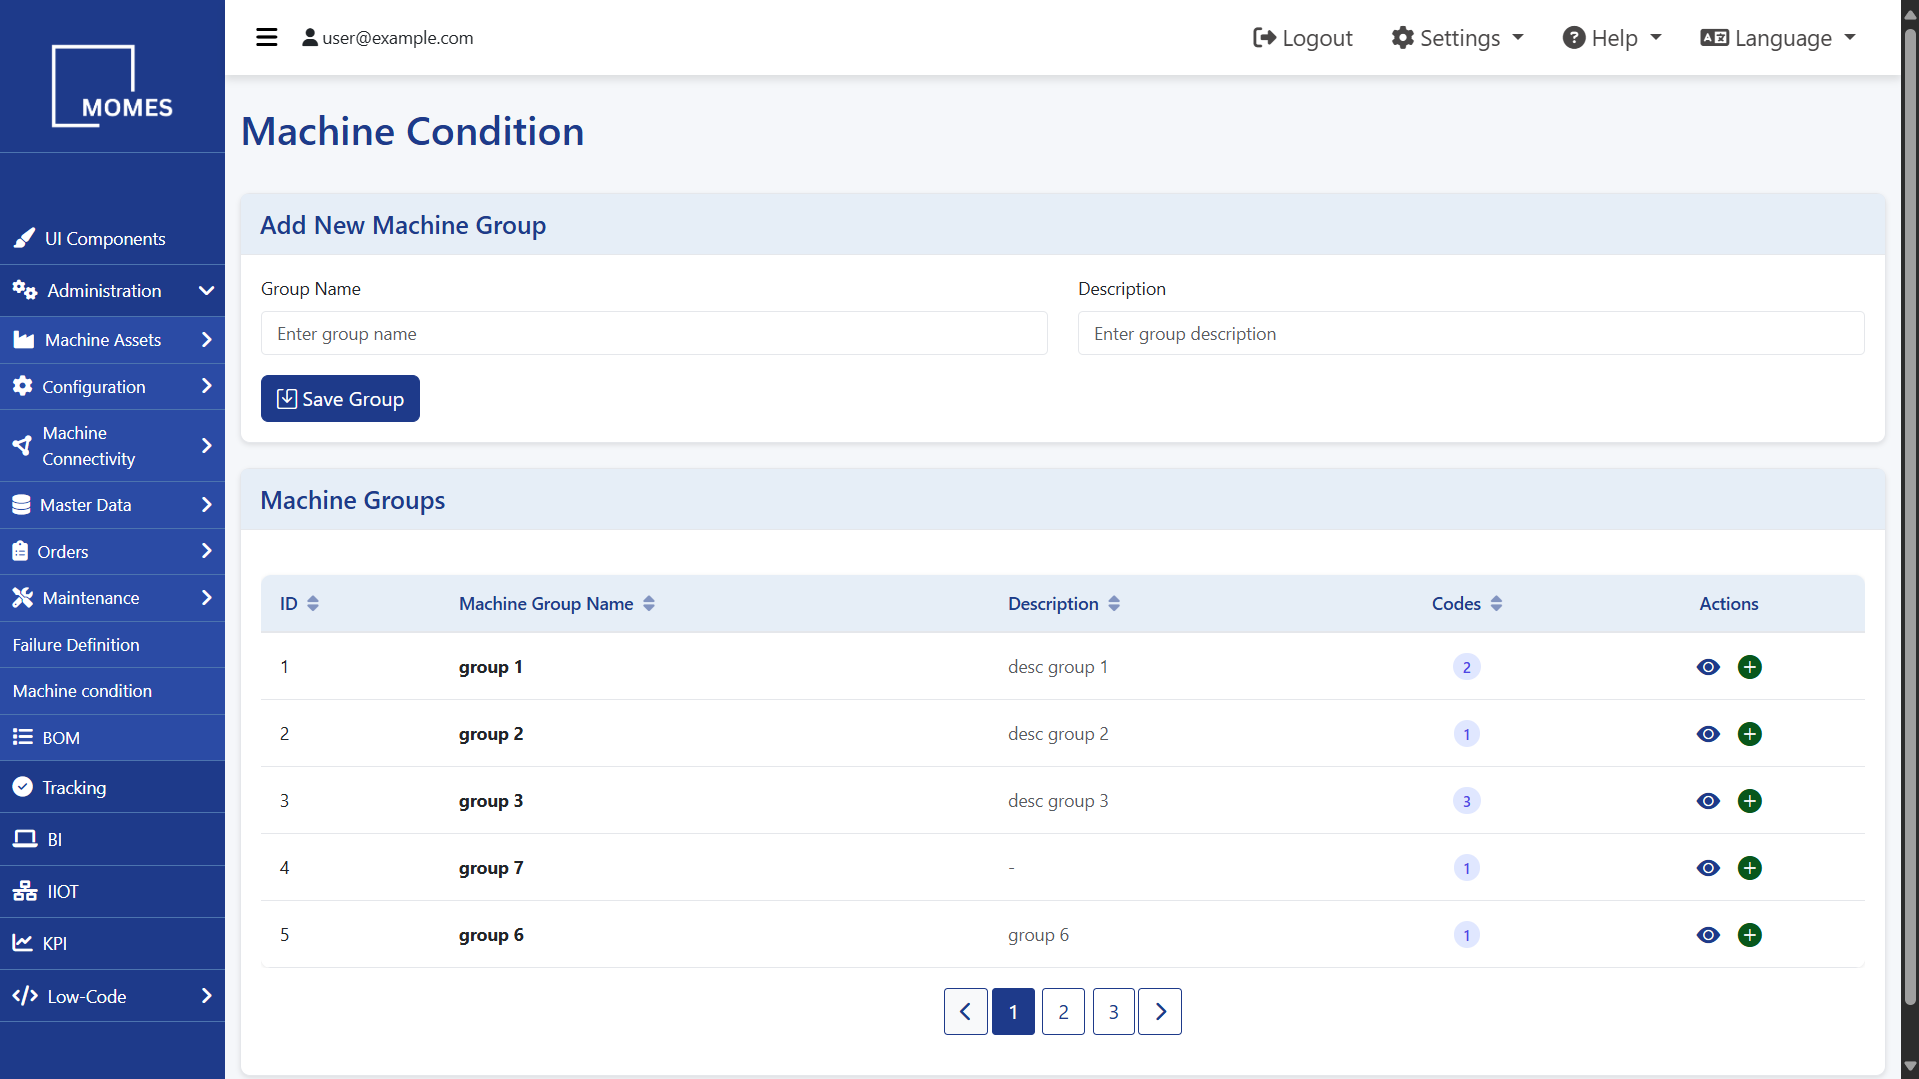
What You See on This Page
- Add New Machine Group section for creating new machine condition categories
- Machine Groups Table: Displays existing machine groups with the following columns:
- ID: Unique identifier for each machine group
- Machine Group Name: The name given to each machine group
- Description: Additional information provided during group creation
- Codes: Number of machine condition codes associated with each group
- Actions: View and Add options for managing condition codes